---
title: "Formulas in the Data Editor"
description: "Calculate totals, percentages, and other values with formulas and fixed cell references"
---
Use formulas to calculate values directly in Grunt's [Data Editor](/powerpoint-add-in/user/data-editor). Start with `=`, reference cells, and use functions such as `SUM`.
## Calculate a total
1. Open the Data Editor from the pencil icon in the edge menu, or double-click a chart.
2. Select the cell where the result should appear.
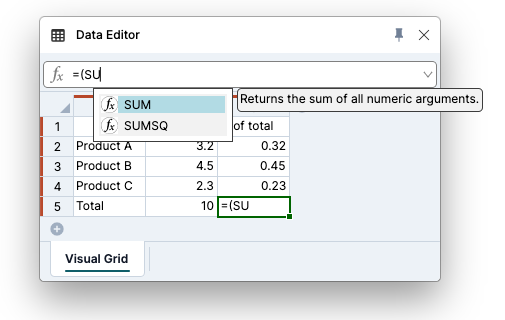
3. Type `=su` and press `Tab` to autocomplete `SUM`.
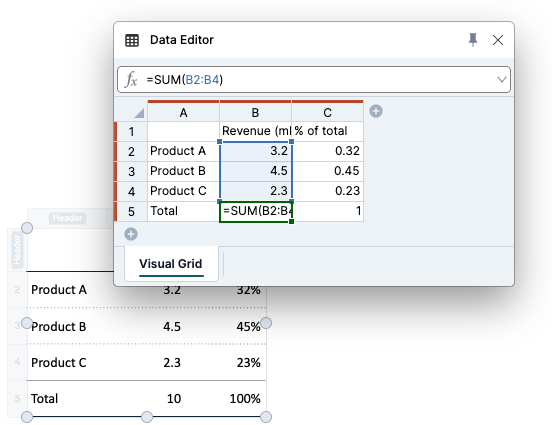
4. Select the cells to add and finish the formula, for example `=SUM(B2:B4)`.
5. Press `Enter` to calculate the result.
 ## Calculate a share of a total
If column B contains revenue and `B5` contains the total, enter this in `C2`:
```text
=B2/$B$5
```
Fill the formula down to calculate the share for each product. The relative reference `B2` changes to `B3`, `B4`, and so on. The dollar signs keep `$B$5` fixed.
## Calculate a share of a total
If column B contains revenue and `B5` contains the total, enter this in `C2`:
```text
=B2/$B$5
```
Fill the formula down to calculate the share for each product. The relative reference `B2` changes to `B3`, `B4`, and so on. The dollar signs keep `$B$5` fixed.
 ## Keep a reference fixed
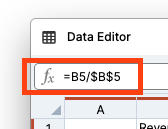
When editing a formula, use `F4` on the reference you want to lock. Check the formula bar to confirm the dollar signs are on the intended row and column.
## Keep a reference fixed
When editing a formula, use `F4` on the reference you want to lock. Check the formula bar to confirm the dollar signs are on the intended row and column.
 ## Fill formulas and patterns
Use autofill to extend formulas or patterns such as numbers, dates, and weekdays. You can also select a range and use `Ctrl` + `D` to fill down or `Ctrl` + `R` to fill right.
Check the copied formulas when you mix relative and fixed references.
## Display percentages
A share such as `0.25` may initially appear as a decimal. To show it as a percentage:
1. Select the result cells in the Visual Grid.
2. Add a **Number format** rule using the **+** button or `Ctrl` + `Enter`.
3. Activate **Magnitude** and choose **Percentages**.
4. Set the number of decimal places you want.
Number formatting changes how the result appears, while preserving its numeric value. See [Number format rule](/powerpoint-add-in/user/rules-text-and-number#number-format-rule).
## Formulas in Excel-connected grids
The **Visual Grid** tab includes changes you make in Grunt. The Excel data tab stays read-only so you can compare those changes with the source workbook.
Editing an Excel-linked cell creates an override; it does not write a formula or value back to Excel. Right-click **Reset cells to original value** or use **Clear all** to return to the source values. If the calculation belongs in your source model, maintain it in Excel and refresh the connection instead.
## Fill formulas and patterns
Use autofill to extend formulas or patterns such as numbers, dates, and weekdays. You can also select a range and use `Ctrl` + `D` to fill down or `Ctrl` + `R` to fill right.
Check the copied formulas when you mix relative and fixed references.
## Display percentages
A share such as `0.25` may initially appear as a decimal. To show it as a percentage:
1. Select the result cells in the Visual Grid.
2. Add a **Number format** rule using the **+** button or `Ctrl` + `Enter`.
3. Activate **Magnitude** and choose **Percentages**.
4. Set the number of decimal places you want.
Number formatting changes how the result appears, while preserving its numeric value. See [Number format rule](/powerpoint-add-in/user/rules-text-and-number#number-format-rule).
## Formulas in Excel-connected grids
The **Visual Grid** tab includes changes you make in Grunt. The Excel data tab stays read-only so you can compare those changes with the source workbook.
Editing an Excel-linked cell creates an override; it does not write a formula or value back to Excel. Right-click **Reset cells to original value** or use **Clear all** to return to the source values. If the calculation belongs in your source model, maintain it in Excel and refresh the connection instead.