
Getting started
Connect Claude to Grunt, create a sample chart, refine it in Grunt Web Studio and place it in PowerPoint
Connect Claude to Grunt, create a sample chart, refine it in Grunt Web Studio and place it in PowerPoint. This guide assumes the Grunt add-in is installed; it focuses on the Grunt ONE connection and workflow.
#Before you start
| You need | Details |
|---|---|
| Grunt ONE access | A Grunt account with Grunt ONE enabled for your organization. Access is arranged through Customer Success. |
| A supported Claude client | A Claude application and plan that lets you add remote MCP connectors. |
| The Grunt PowerPoint add-in | A current Grunt add-in build in a supported PowerPoint. See the PowerPoint guides. |
| Sample data | Use the fictional figures in this guide for your first task. |
An existing PowerPoint license does not activate Grunt ONE. Your assistant uses Grunt user sign-in for this workflow; you do not need to create a backend integration client.
For administrators: Start with Security and data. If you are arranging managed Claude access for your organization, review Managed Claude authentication with Grunt. The walkthrough below verifies the MCP connection; plugin skills and live PowerPoint access need separate setup and checks.
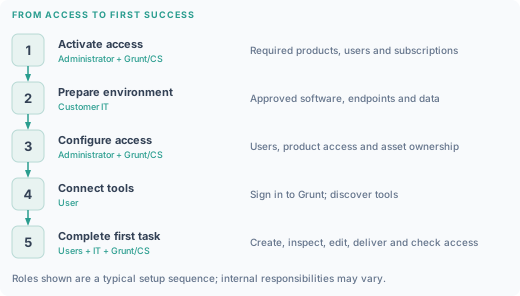
See Plans and AI access for what each workflow needs and Security and data for data handling and access.
#Connect Claude and create a chart
#1. Add the Grunt connection
- Open Claude's connector or MCP settings.
- Add a remote server with the URL
https://mcp.grunt.io/mcp. - Connect, sign in to Grunt and approve access.
- Check that Grunt tools are available to Claude.
Expected result: Claude can discover Grunt tools. Continue with the sample chart to check that it can use them.
Administrator note: The client must support remote MCP over Streamable HTTP with OAuth. Production authorization uses https://auth.grunt.io/. Assets created through user sign-in belong to that user's Grunt account. If your organization restricts connectors, an administrator may need to approve the Grunt connection first.
#2. Create and inspect a chart
Before supplying data: Asset creation returns a view link. Anyone with the link can access the visual and its underlying data. Use the fictional sample below for your first chart.
Create a revenue waterfall in millions: opening revenue 120, expansion +18, new customers +12, churn -5. Show the closing total and explain the values used.
Expected result: The closing value is 145. Check the labels and units, and ask Claude to inspect the chart's data as well as its image.
References: Connect and authenticate and Tool reference.
#Refine the chart and use it in PowerPoint
#3. Edit in the browser
Open the link Claude returns with the chart (its exportGuideUrl, a page on app.grunt.io). Sign in with the same Grunt account you connected Claude with, and open the chart in Grunt Web Studio from there. Inspect the data, change a label or color, and save a version.
Expected result: The saved chart includes your change and you can identify the version to use in PowerPoint.
#4. Place the chart in PowerPoint
In PowerPoint, sign in to the Grunt add-in with the same account. Open Library from the Grunt ribbon, find the chart in the Web Assets group and insert it. The placement becomes an editable Grunt object; its data and formatting are edited with Grunt's tools rather than PowerPoint's built-in chart model.
Expected result: The chart in PowerPoint matches the saved values and formatting.
#5. Revise and check the result
Change new-customer revenue from +12 to +10 in the source asset. The expected closing total becomes 143. Refresh or re-import the chart in the presentation.
Edits you make to the local object in PowerPoint are saved in the presentation and are not automatically published back to the web asset. Review any commentary affected by a change to the figures.
Continuous synchronization
Accepted changes move between Grunt Web Studio, PowerPoint, and reports without an explicit refresh or import.
#Completion check
You can create a chart, inspect its data, edit and save it, place it in PowerPoint, and reproduce the revised total. Confirm that the intended recipient can open the presentation and that its links and embedded data are appropriate to share.
References: Connected workflows.
#Other outputs, shared work and support
#HTML reports
The HTML skill guides Claude in combining written analysis and Grunt visuals in a browser-readable report. See Deliver an HTML report.
#Other assistants
Any assistant that supports remote MCP over Streamable HTTP with OAuth can connect to Grunt the same way. Follow Connect and authenticate for your client.
#Collaboration and handover
Assets created through your sign-in belong to your Grunt account. Share a view or edit link to give colleagues access; sharing a link does not transfer the asset to another account. For team-owned assets, use an organization integration. See Security and data for link behavior and offboarding.
#Troubleshooting
| Symptom | First check |
|---|---|
| Cannot add the connection | Supported client and administrator connector policy. |
| Sign-in fails or expires | Grunt access and permissions; reconnect and complete authorization. |
| Asset is missing | The account used to create it and the account currently signed in. |
| A tool fails | Refresh the tool list and check the current tool name and input requirements. |
| A revision does not reach PowerPoint | Refresh or re-import the placement with the Grunt add-in. |
Contact Customer Success for access and onboarding, or Grunt support for technical help. Include the attempted action, client/add-in version, approximate UTC time and any reference ID. For MCP errors, include the endpoint and tool name. Do not include tokens or credentials.
References: MCP troubleshooting.