
Data Editor
Edit cells, inspect hidden data, and reset Excel overrides in a spreadsheet view
The Data Editor shows the data behind a Grunt object, including hidden rows and columns that still drive rules. Use it for larger edits or to compare your visual with its Excel source.
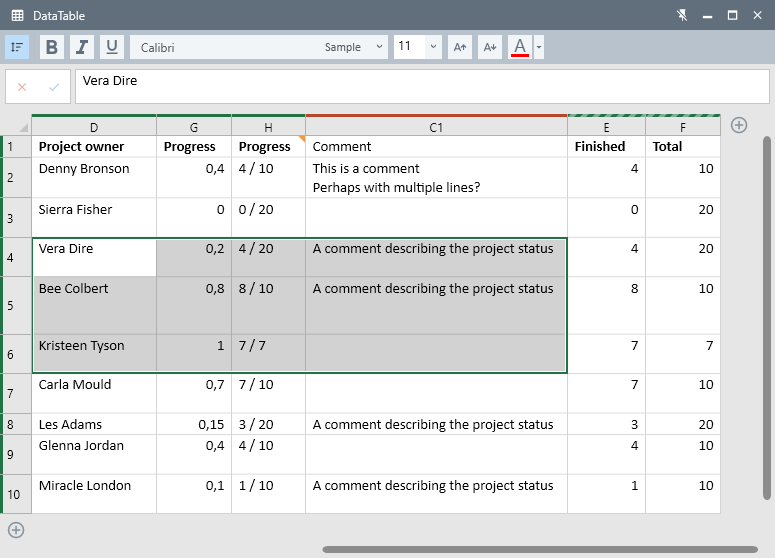
#Open the Data Editor
Select the Grunt object, then use one of these methods:
- Click the pencil icon in the edge menu at the right of the PowerPoint window.
- Press
Ctrl+Shift+E. - Right-click and choose Edit data.
For charts, you can also double-click the chart to open its data.
#Edit cells and multi-line text
Type directly into a cell for a single-line value. Press Enter or Tab to commit the edit.
For multi-paragraph text, use the formula bar above the grid. In that bar, Enter adds a line break and Ctrl + Enter commits the edit.
You can also calculate values with =SUM(...), reference other cells, and fill formulas down. Follow Formulas in the Data Editor for examples.
#Read the row and column colors
The thin colored strips above columns and beside rows show where the data is stored:
| Indicator | Meaning |
|---|---|
| Green | Data comes from Excel. |
| Dark orange | Data is embedded in the PowerPoint presentation. |
| Dashed green or orange | A helper row or column is hidden in the Visual Grid. |

A hidden row or column can still supply values to rules. You can mix Excel data with rows or columns you insert and maintain in PowerPoint.
#Navigate and select
| Action | Shortcut |
|---|---|
| Move between cells | Arrow keys |
| Extend the selection | Shift + arrow key |
| Jump to the beginning or end | Ctrl + arrow key |
| Move to the next / previous cell | Tab / Shift + Tab |
| Select all cells | Ctrl + A |
| Select a column | Ctrl + Space |
| Select a row | Shift + Space |
#Edit several cells at once
Select a range, then:
- Press
Ctrl+Dto fill down from the first row. - Press
Ctrl+Rto fill right from the first column. - Type a value and press
Ctrl+Enterto enter it in every selected cell.
#Compare the visual with Excel
For an Excel-connected Visual Grid, the editor has two tabs. Visual Grid is the working view, including your edits. The tab named after the Excel data shows the source as a read-only view.

#Manage overrides
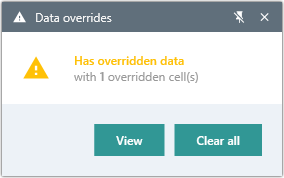
Editing an Excel-linked cell in PowerPoint creates an override. It leaves the workbook unchanged and keeps the original Excel value underneath your edit. Overridden cells have a colored corner marker and an override warning.
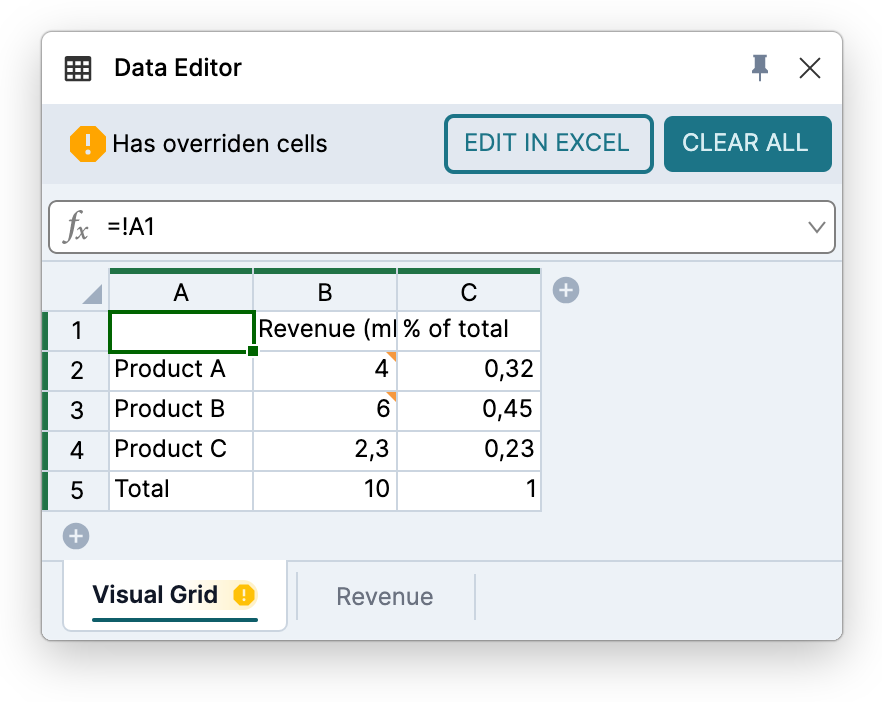
To restore one cell, right-click it and choose Reset cells to original value. To restore all overridden values, use Clear all in the editor or the override warning in the edge menu.
For refresh behavior, shared workbooks, and permissions, see Excel connections.