
Gantt
Present project tasks, milestones, and calendar scales in a dynamic timeline
Use Gantt to present project tasks and milestones directly on a slide. Its layout adapts to your content: multi-line task descriptions can increase row heights while keeping the timeline aligned.
Timelines use calendar dates so the chart can place tasks and milestones against a shared time axis.
#Choose the time scale
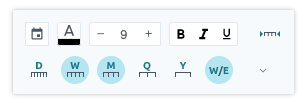
Click the time or date axis to open its toolbar. Show the levels you need: years, quarters, months, weeks, or individual dates. Use a broader scale for an overview and more detail for a delivery schedule.
#Add separators and shading
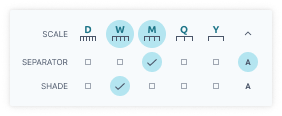
Expand the time and date options to choose separators and shading for the visible scales. These help distinguish periods without manually drawing background shapes.
#Organize swimlanes
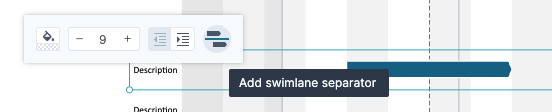
Click a swimlane to open its controls. Indent rows to show hierarchy and add swimlane separators to distinguish workstreams.
For more guided examples, open Grunt Academy.
Watch the Gantt walkthrough for a video demonstration.