
Rules
Add reusable formatting rules, choose targets, and control precedence
Rules keep formatting separate from data. A rule can change a font or border, or turn values into icons, gauges, and charts. Define the behavior once and let it respond when your data changes.
#Add a rule
- Select the cells, rows, columns, or chart elements you want to change.
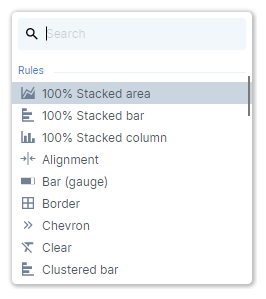
- Right-click Add rule, press
Ctrl+Enter, or click + beneath the rule stack. - Search for a rule and double-click it to add it.
- Activate the properties you want to change.
#Activate rule properties
The top of the rule dialog contains its properties. Most start in Default, which leaves the existing setting unchanged.
Click + next to a property to activate it, then choose a value. Click − to return it to Default. Some properties offer several modes from the + menu.
For example, activate Color in a Font rule to set text color without changing the font family or size.
#Target the right areas
The target section at the bottom of the dialog determines where the rule applies. Selecting an area before adding a rule creates an initial target automatically.
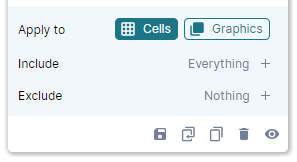
A rule applies to everything in Include, minus everything in Exclude. Hover over a target entry to highlight the corresponding area on the slide. Use + to add another target.
Depending on the rule, Apply to can target:
- Cells: the underlying cells of a Visual Grid.
- Text: the text inside the object.
- Graphics: shapes, chart elements, gauges, and other graphics produced by rules.
To keep formatting useful as the grid grows, prefer row and column types or tags over a list of fixed row IDs.
#Understand the rule stack
Rules appear in the edge menu. They apply from the bottom upward, so the higher rule wins when two rules control the same property on the same target. Drag a rule up or down to change its priority.
If a rule seems to do nothing:
- Check that the property is activated.
- Hover its targets to confirm the expected cells or graphics are included.
- Select the affected element. Rules that target it light up green in the stack.
- Check whether a higher rule overrides the property.
#Choose a rule
| What you want to change | Rules |
|---|---|
| Text appearance, paragraphs, and numbers | Font, paragraph style, and number format |
| Cell color, borders, and text direction | Fill, border, and text rotation |
| Placement, spacing, merging, and size | Alignment, margin, merge, and size |
| Remove specific formatting | Clear |
| Process steps and headers | Chevron and header underline |
| Repeated or value-dependent icons | Icon and icon conditional |
| Company logos | Logo |
| Progress and proportions | Donut and bar gauges |
| Use another cell's data to drive a visual | Value Source |
For a worked example combining a display column with hidden numeric data, follow Stacked bars in a Visual Grid.