
Stacked bars in a Visual Grid
Combine custom labels and stacked bar charts in one Visual Grid
Build a stacked bar chart inside a Visual Grid when you need more control over label placement and surrounding content than a stand-alone chart provides.
#Prepare the data
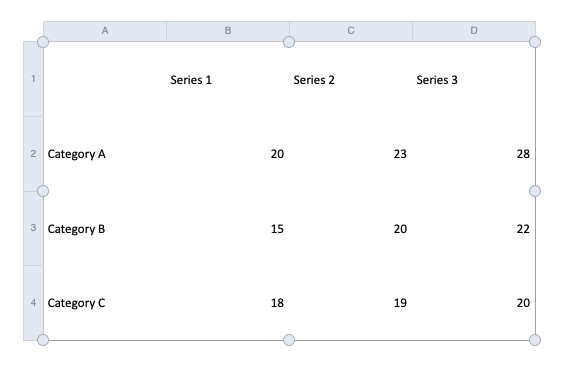
Paste or enter category labels in column A, followed by one numeric column per series. You can use embedded data or an Excel connection.
#Add a display column
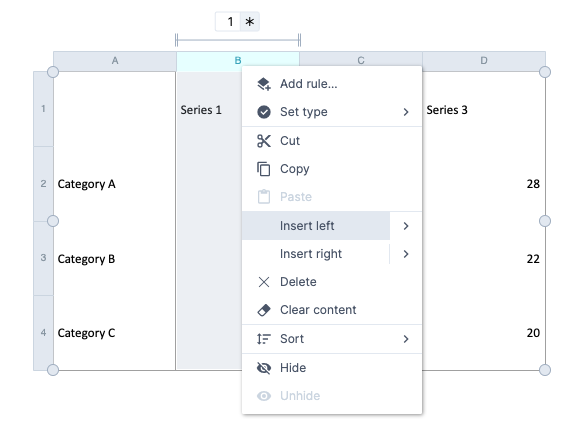
Right-click column B and insert a new column to its left. This new column B will display the bars; the numeric values move to columns C, D, and E.
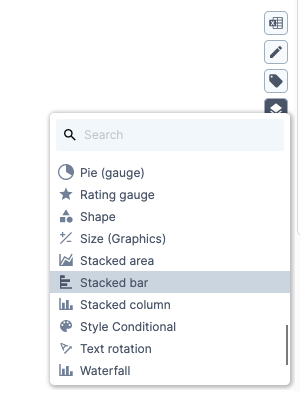
Select the new column and add the Stacked bar rule.
#Point the rule to the numeric data
Open the Stacked bar rule and choose Data. Set the first series target to column C, where the numeric data now starts.
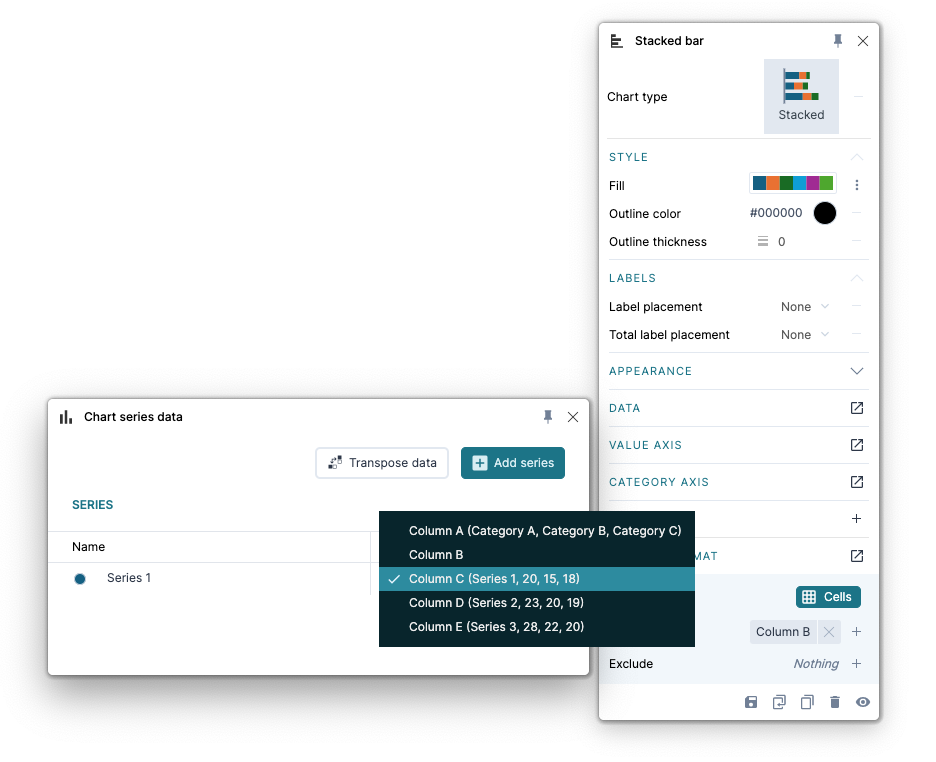
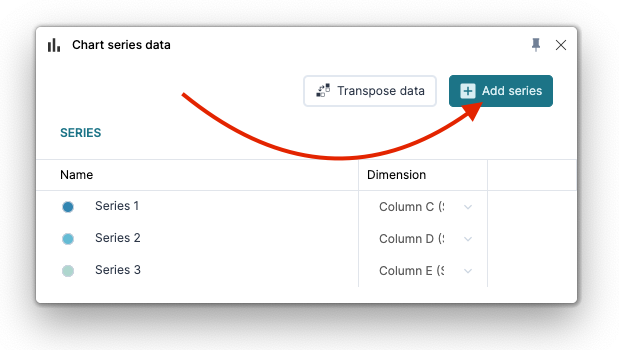
Click Add series for each additional numeric column. Grunt advances through the columns to the right as you add series. Check the series list before continuing.
#Hide helper columns and style the chart
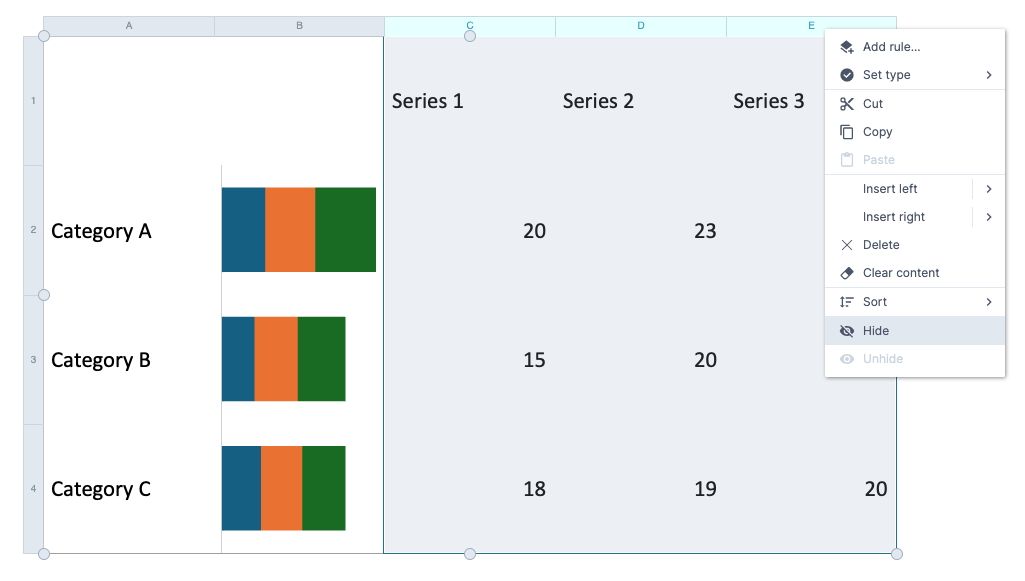
Hide columns C, D, and E using their context menu. Hiding changes what appears on the slide; the numeric data remains available to the chart rule.
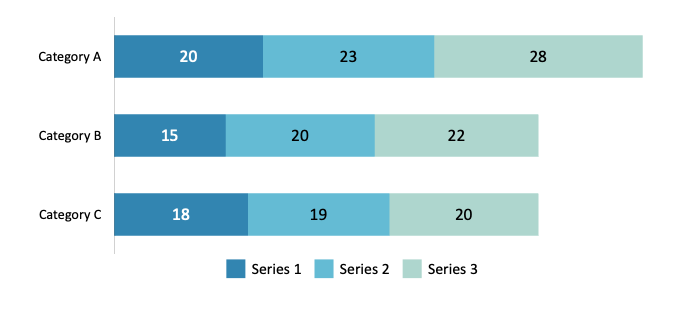
Adjust the chart's colors, labels, and legend in the rule. You now have category labels and a stacked bar display in the same grid.
Use row types and tags to keep surrounding formatting reusable as the grid changes.