
Waterfall charts
Build waterfalls, calculate totals, move connectors, and upgrade classic charts
A waterfall explains how a starting value changes through positive and negative steps. Use it for cash flow, costs, budget movements, and subtotals.
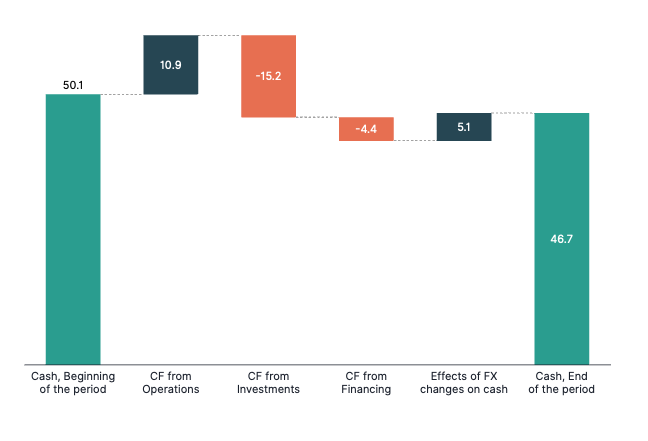
#Insert and edit a waterfall
Choose a waterfall from Charts in the Grunt ribbon. Double-click the inserted chart to open its Data Editor. You can also connect the chart to Excel.
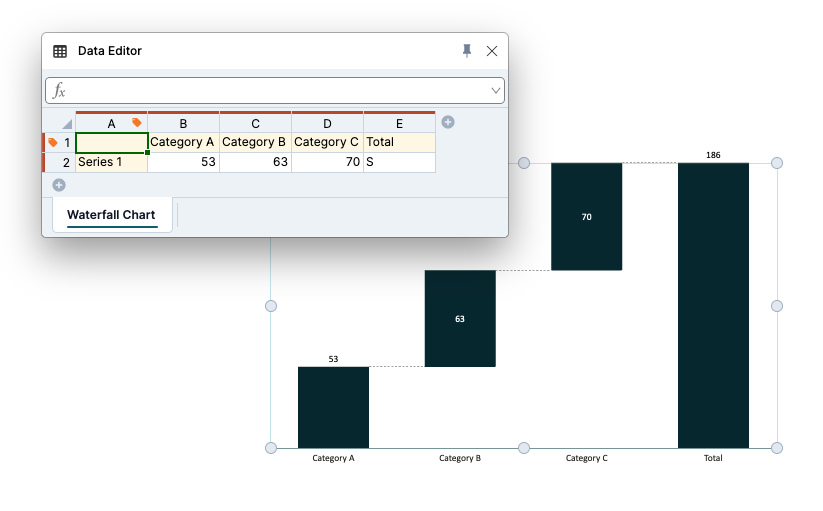
#Calculate totals with S and s
In the Data Editor:
- Capital
Scalculates a total across all series. - Lowercase
scalculates a total for an individual series, which is useful in a stacked waterfall.
Use a build-down waterfall when you want to start with a total and show deductions reducing it.
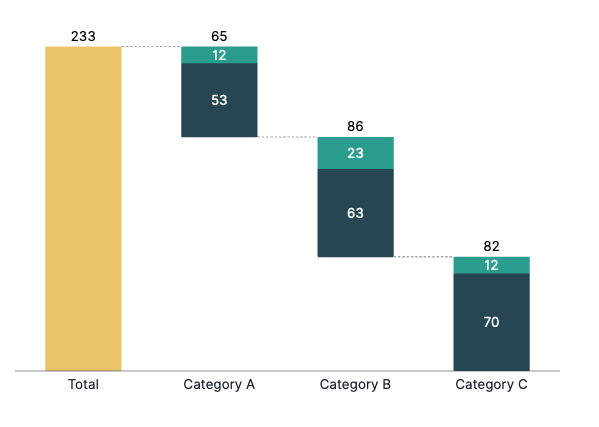
Add multiple series and use per-series totals to create a stacked waterfall.
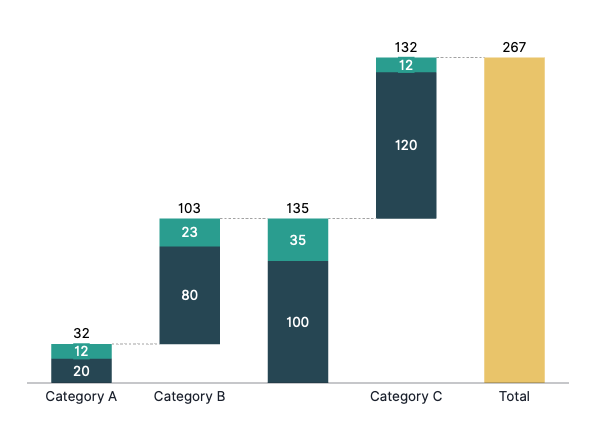
#Connectors and pre-calculated totals
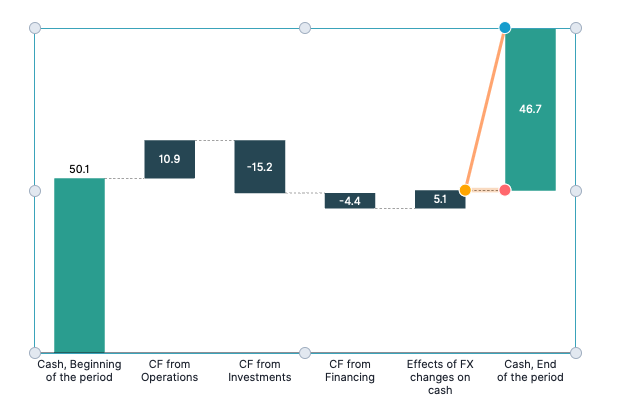
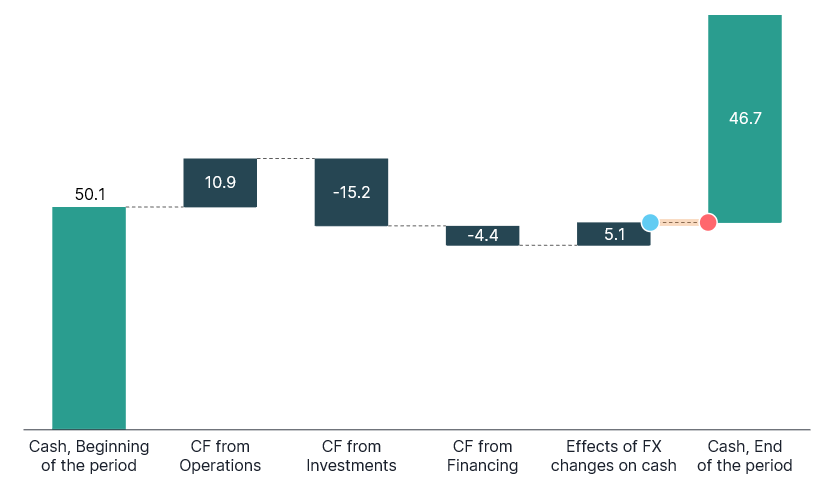
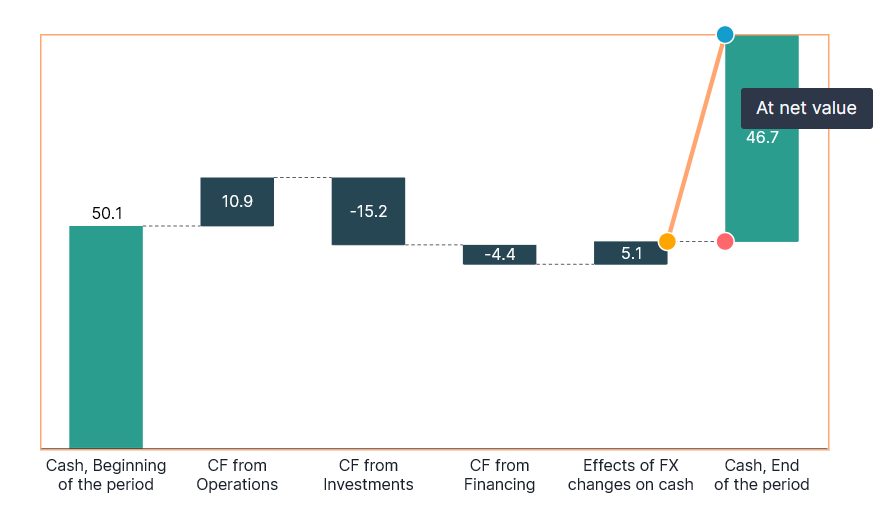
Connectors show how the calculation progresses between columns. If Excel already supplies a numeric total, Grunt may initially treat it as another change.
Click the connector leading to the total and drag its anchor from the bottom of the total column to the top. This makes the connection meet the column's net value instead of adding it as another step.
#Add a reference column
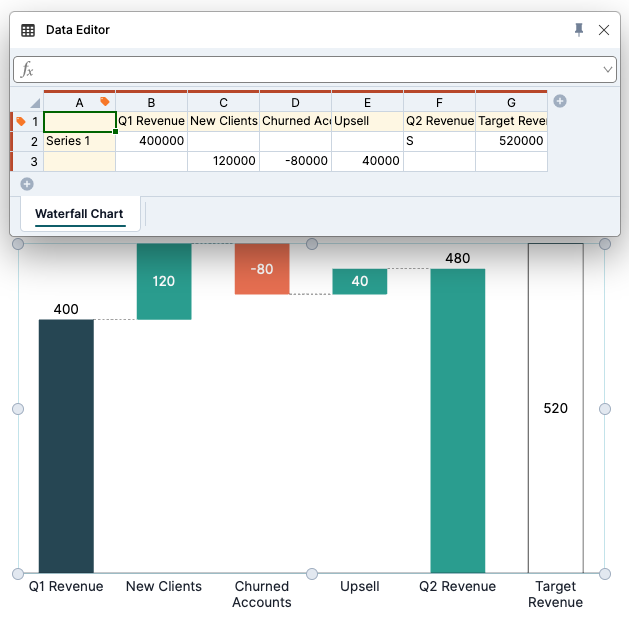
To show a budget or benchmark alongside the waterfall, enter its value, select its connector, and press Delete. The column becomes a separate reference instead of contributing to the running calculation.
#Create a floating subtotal
Move existing connector anchors to define the subtotal. Right-click the chart and choose Add Connector if you need another connection. Check the connector at the subtotal's base so that the subtotal is not counted again in the final total.
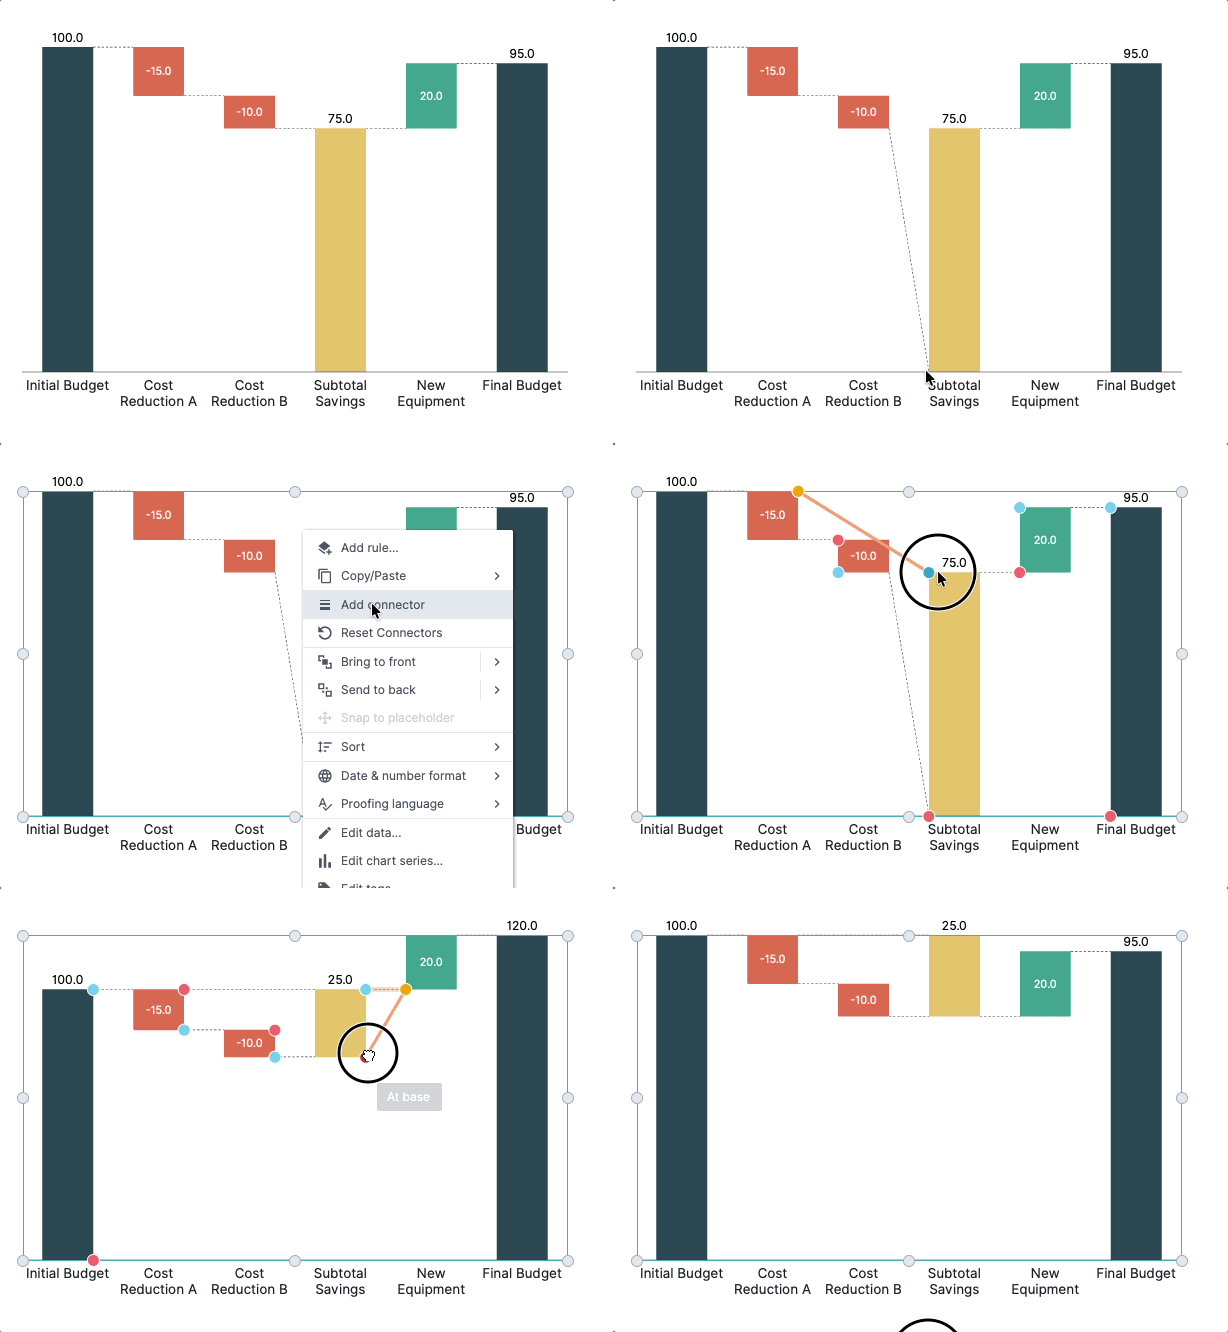
Floating sums display absolute totals. For example, a subtotal of 25 displays as 25, even when the segment represents a negative change. This also prevents that sum label from receiving negative-number color formatting.
To start over, right-click the chart and choose Reset Connectors.
#Upgrade classic waterfall charts
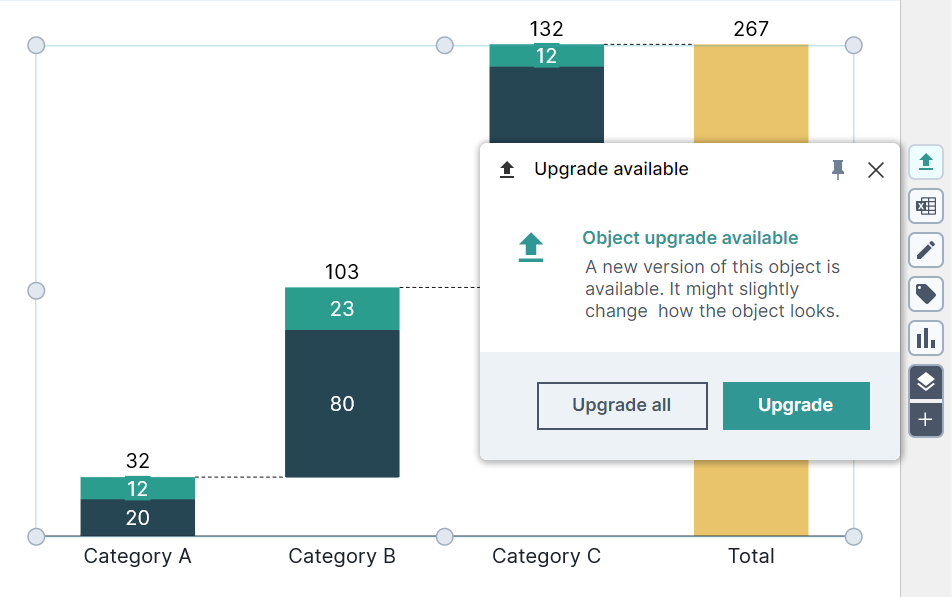
Waterfalls created before Grunt 2025.2 can be upgraded to Advanced Waterfall from the edge menu. Upgrade when you need movable connectors; you do not have to upgrade every old chart.
- Select a classic waterfall and click the upgrade control in the edge menu.
- Choose to upgrade that chart first.
- Review its totals, connectors, excluded segments, and styling before upgrading more charts.
#Replace force-to-baseline behavior
Advanced Waterfall uses connector positions instead of the classic force-to-baseline button. For hardcoded or Excel-provided totals, move the incoming connector to the top of the total column.
Move a connector after upgrading
#Review excluded series
The classic exclude-from-sum behavior is also controlled through connectors after upgrading. Move the connectors for each segment that should stay outside the total, such as an uncertain projection.
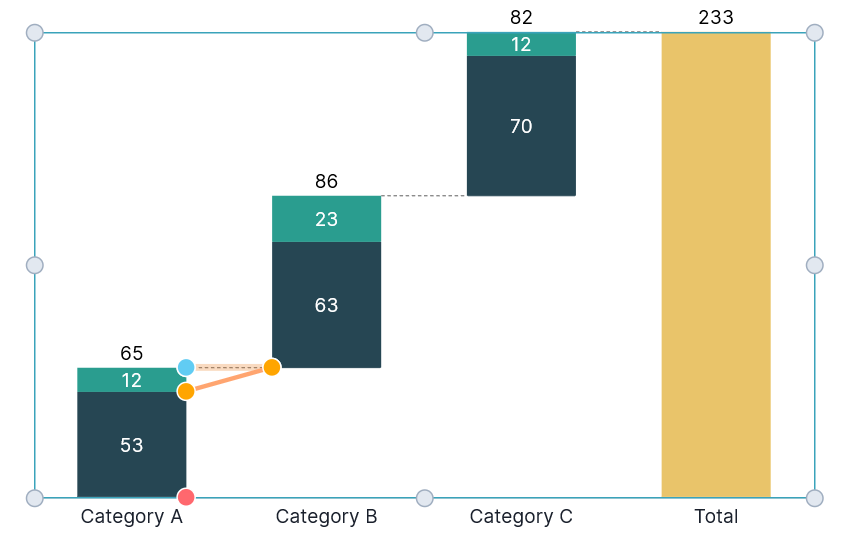
Check borders and connector dash styles after conversion: default colors and some dash patterns can differ from the classic chart.
Watch the waterfall tutorial for a video walkthrough. For stable plot dimensions, see Fixed chart area.